September 2026 at a glance
Australia: private house approvals fell 5.3% to 10,432 in September 2026 (seasonally adjusted, ABS). The headline 5.1% rise in total dwellings, to 17,948, came from units, townhouses and apartments, which rose 16.6% to 6,579.
Queensland: house approvals fell 5.1% to 2,407, while total approvals rose 28.0% to 4,382 on a rebound in apartments.
Value of building: the value of all building approved rose 13.0%, but the whole of that increase came from non-residential building, where data centre projects are reported as a major driver. The value of residential building approved fell 2.8%.
Rates and home values: the RBA decides on rates on 3 November, and all four major banks expect a rise to 4.85%. National home values fell 1.2% in October and are 6.7% below their March peak.
What it means: most builders are busy on current jobs, but easing house approvals could mean fewer new contracts in 2027, so now is the time to check the pipeline, pricing and cash reserves.
The ABS released its September 2026 figures on 2 November 2026 – and it comes with mixed outcomes, particularly if you are in the residential housing space. Private house approvals, the series that matters most to builders of detached homes, fell 5.3% to 10,432, seasonally adjusted, the largest monthly fall since August 2025.
The figure most reports led with was a 5.1% rise in total dwelling approvals, to 17,948. That rise came from a 16.6% rebound in approvals for units, townhouses and apartments, to 6,579, after those approvals fell sharply in August. Total dwellings were down 0.8% on September 2025, and the ABS has revised August’s fall to 5.2% (first published as 6.1%). The value figures show a similar pattern, with data centre projects lifting non-residential approvals while the value of residential building fell.
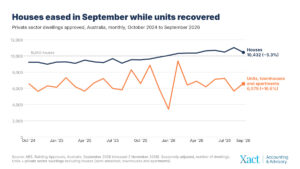
Private house approvals have stayed above 10,000 a month since January 2026, while approvals for units, townhouses and apartments swing sharply from month to month. Source: ABS, Building Approvals, Australia, September 2026. Seasonally adjusted.
For business owners in construction, these figures, along with other concerning signs in the wider economy point to what many are discussing in the sector; that there is a distinct slowing in demand. Whilst we might not have a full-blow recession on our hands, for construction these conditions could lead to more competition and more pressure on margins and cash.
Clear reporting on the margin each job is earning, and on the cash the business will hold over the coming weeks, gives an owner time to adjust quoting, pricing and spending before a tight month arrives. If you would like to see where your own business stands, our advisory team can work through your margins and cash flow forecast with you.
How many dwellings were approved in Australia in September 2026?
In trend terms, total dwelling approvals rose 1.3% in September to 18,705 a month, and were 10.6% higher than in September 2025. The rising trend suggests the August fall was driven mainly by a one-month drop in unit approvals rather than a broad turn in the market. Trend house approvals were close to flat, up 0.1% to 10,687.
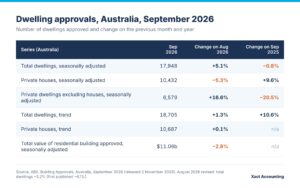
Source: ABS, Building Approvals, Australia, September 2026. The ABS revised August in the September release: total dwellings now fell 5.2% in August (first published as 6.1%) and private sector houses rose 5.4% (first published as 3.7%).
What is behind the 13.0% rise in the value of building approved?
The ABS also reports the dollar value of all building approved, which covers homes as well as non-residential building such as offices, warehouses, hospitals and data centres. In September 2026 that total rose 13.0% to $19.02 billion, seasonally adjusted.
Non-residential building approved rose 45.9% to $7.96 billion, an increase larger than the rise in the total, while the value of residential building approved fell 2.8% to $11.06 billion.
CreditorWatch has reported data centre projects as a major driver of non-residential approvals through 2026, including in September. Data centres add nothing to the number of homes approved, so the total value figure describes a stronger market than the one residential builders are working in. CreditorWatch also expects data centre construction to keep pressure on labour and materials costs, which matters for residential builders pricing fixed-price work while house approvals ease.
Why do house and unit approvals move so differently?
House and unit approvals draw on different builders, trades and finance, and the two series behave differently. September was the ninth month in a row with more than 10,000 private houses approved, so the 5.3% fall came from a high level. The unit series moves sharply from month to month because a single large apartment project can be approved at once. In Queensland, apartment approvals dropped from 1,330 in July to 337 in August (original terms, not seasonally adjusted), and September’s rise recovered much of that fall, led by apartments in NSW and Queensland. Even after that rise, unit approvals were 20.5% lower than in September 2025.
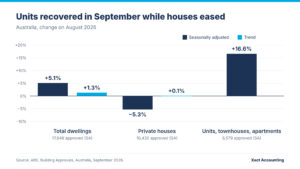
Source: ABS, Building Approvals, Australia, September 2026.
How did Queensland, NSW and Victoria compare in September 2026?
The national figure hides real differences between the states, and the housing markets in each state are moving at different speeds. In September, NSW and Queensland rose on units and apartments, Victoria fell, and house approvals fell in every state the ABS publishes.
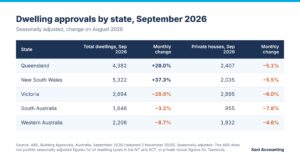
Source: ABS, Building Approvals, Australia, September 2026. Seasonally adjusted, change on August 2026. The ABS does not publish seasonally adjusted figures for all dwelling types in the Northern Territory and the ACT, or private house figures for Tasmania. Tasmanian total approvals fell 25.7% in September.
Queensland. Total dwelling approvals in Queensland rose 28.0% in September to 4,382, seasonally adjusted, while house approvals fell 5.1% to 2,407. The rise came from units and apartments after August’s sharp fall, and the trend series, which smooths out those swings, fell 0.6% to 4,264 for total dwellings and rose 0.4% to 2,432 for houses. Queensland also had a record 52,567 dwellings under construction in the June quarter 2026 (ABS Building Activity, preliminary), while Brisbane home sales over the three months to October were 29% lower than a year earlier (Cotality).
New South Wales. Total dwelling approvals in NSW rose 37.3% to 5,322, the highest of any state in September. The ABS reported that apartments drove the rise, with 1,995 apartments approved in NSW in September compared with 901 in August. NSW was the only state where private house approvals fell in August, and they fell again in September, down 5.5% to 2,035 (seasonally adjusted) and 1.8% in trend terms.
Victoria. Victoria approved 3,694 dwellings in September, down 28.9% on August, when it had recorded the highest number of any state. Private house approvals fell 6.0% to 2,895. The trend series gives a steadier picture: Victorian approvals rose 1.8% in trend terms to 5,168, still the highest of any state, and Victoria recorded 16,239 dwelling commencements in the June quarter 2026, the most of any state (ABS Building Activity, seasonally adjusted, preliminary).
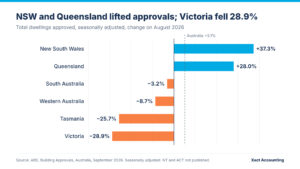
Source: ABS, Building Approvals, Australia, September 2026. Seasonally adjusted.
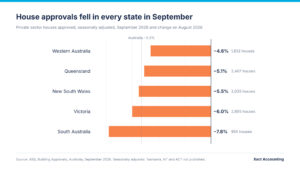
Private sector houses approved, September 2026. Source: ABS, Building Approvals, Australia, September 2026. Seasonally adjusted, change on August 2026. Tasmania, NT and ACT not published.
Are renovation approvals rising or falling?
The ABS also reports the value of alterations and additions approved, which covers extensions, structural renovations and other work on existing homes that needs approval. In September 2026 that value was $1.32 billion, seasonally adjusted, up 0.8% on August and 13.0% higher than a year earlier, well ahead of the 4.7% rise in new dwelling prices. The trend has eased every month since its April 2026 peak of $1.36 billion, falling 0.7% in September to $1.31 billion, as falling home values leave owners with less equity to borrow against. A renovation builder’s order book may still look healthy, but enquiries could slow or shift toward smaller jobs through 2027, so it is worth tracking the average contract value alongside the number of enquiries and quotes won.
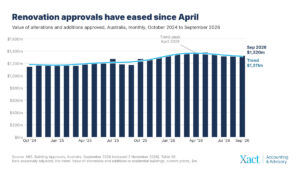
The value of renovation approvals was 13.0% higher in September 2026 than a year earlier, well ahead of the 4.7% rise in new dwelling prices, but the trend has eased every month since its April 2026 peak. Source: ABS, Building Approvals, Australia, September 2026, Table 38. Seasonally adjusted and trend, current prices.
What do other indicators say about demand for new homes?
Building approvals are one measure of demand for new homes, and several other measures across the economy point the same way. Home loan applications were 19.2% lower in September 2026 than a year earlier, the sixth monthly fall in a row, and first home buyer applications were 22.1% lower (Equifax). National home values have fallen for seven months in a row and were 6.7% below their March 2026 peak in October (Cotality), which leaves owners with less equity to borrow against. Households and businesses are both cautious: the Westpac-Melbourne Institute consumer sentiment index was 80.4 in October, among the 40 weakest readings since the early 1970s (Westpac IQ), and NAB’s business confidence index was -13 in September, in the weakest 5% of readings in the survey’s history (NAB).
Home loan applications often move before building approvals, because buyers arrange finance before a new home is designed, contracted and approved, so a six-month run of falling applications is consistent with fewer house approvals in the coming months. Not every measure is weak: lending to build a home was still rising in the June quarter, and a record 248,733 homes were under construction across Australia in the same quarter. The September quarter lending figures will show whether construction lending held up as interest rates rose.
What do building approvals mean for a builder’s pipeline, cash flow and pricing?
With fewer new projects expected to come through over the next 6 to 12 months, three areas of the business deserve close attention.
- Investment in sales and marketing. Builders are entering a more competitive market than many have worked in for years, with more firms chasing fewer new projects. It may be worth increasing the investment in sales and marketing, and measuring the enquiries, quotes and signed contracts each channel produces, so that the spend goes where it is working.
- Financial clarity on margins and cash flow. Job-by-job reporting shows the margin each project is earning against the margin quoted, which helps a business stay competitive on price without quoting below the margin it needs to stay financially strong. The same discipline applied to a rolling cash flow forecast shows how job scheduling, and any delay where a client falters or a payment is held up, would affect working capital, so there is time to act before a gap opens.
- The type of work taken on. Smaller, shorter projects such as renovations usually turn into cash faster than new builds, so a different mix of work may be worth considering, provided each job still earns the margin the business needs.
“When economic conditions get tougher, it becomes even more important for a construction business to have 100% clarity on its financial position: the margin on every job, the cash it will hold over the coming months and the work it has in the pipeline. That clarity will be one of the deciding factors in which businesses stay resilient through a downturn.”
David Holzgrefe, Partner and Client Director, Xact Accounting & Advisory
Talk it through with us
If you would like to work through what the latest figures mean for your own pipeline, cash flow or pricing, our construction team can sit down with you and go through your numbers.
Book a time to talk with a construction adviser.
This article is general information about the construction market and is not advice for any particular business. Please speak with an adviser about your own circumstances.
Sources
- Australian Bureau of Statistics, Building Approvals, Australia, September 2026
- Australian Bureau of Statistics, Building Activity, Australia, June quarter 2026
- Australian Bureau of Statistics, Consumer Price Index, Australia, September quarter 2026
- Cotality, Home Value Index, October 2026
- Equifax, Consumer Market Pulse, September 2026
- Westpac-Melbourne Institute, Consumer Sentiment, October 2026
- NAB Monthly Business Survey, September 2026
- CreditorWatch, via CFOtech, November 2026